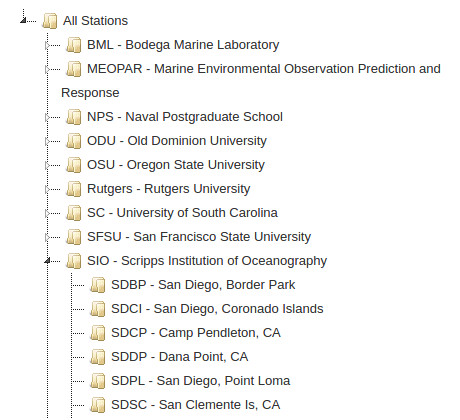
The tree view on the left allows the user to navigate between different reports. Sections of the tree can be expanded/collapsed to show/hide networks and/or stations. Clicking on the white arrows will expand the tree while clicking on the black arrows will collapse the tree.
Click on the arrows to expand/collapse the tree.
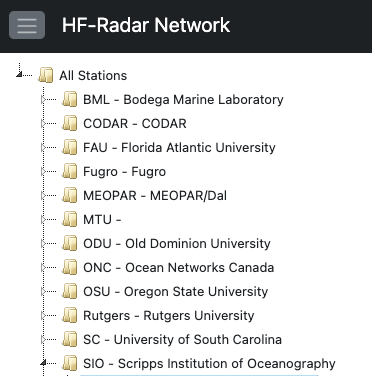
In addition the tree view can be hidden to maximize the viewing screen by clicking on the
Click on the to hide/show the tree
Summary Views
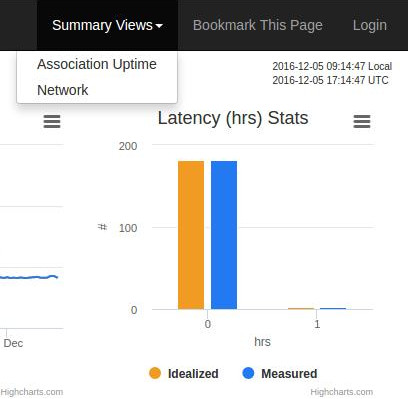
Currently there are two summary reports: Association Uptime and Network.
To view the Association Uptime report, click on the 'All Stations' text in the tree view.
'All Stations' will open up the Association Uptime report
Alternatively, clicking on the 'Summary Views' menu option will show a list of summary reports.Summary Views contain a list of summary reports
Network Views
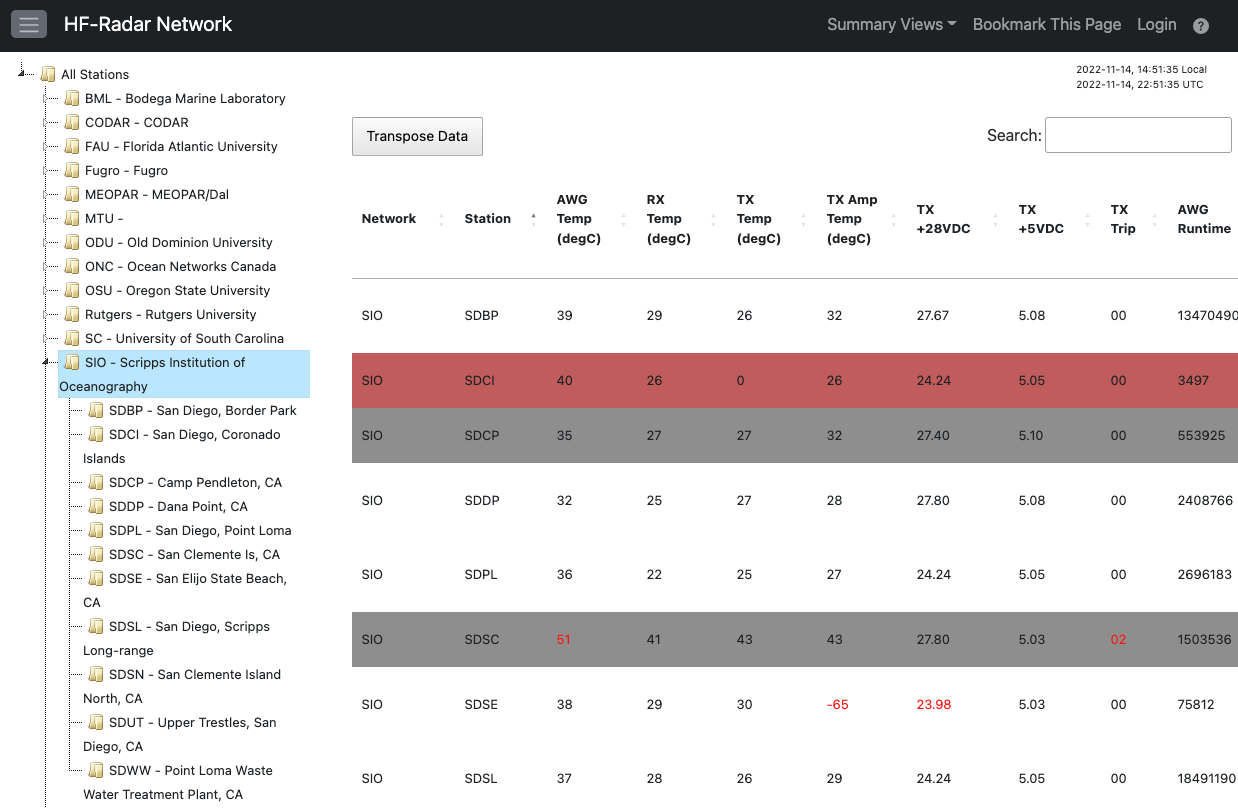
The network views allow a user to view relevant data on all their sites within their network.
To view a network's summary page, click on the network name in the tree view.
Clicking on a station row/column will open up the station view.
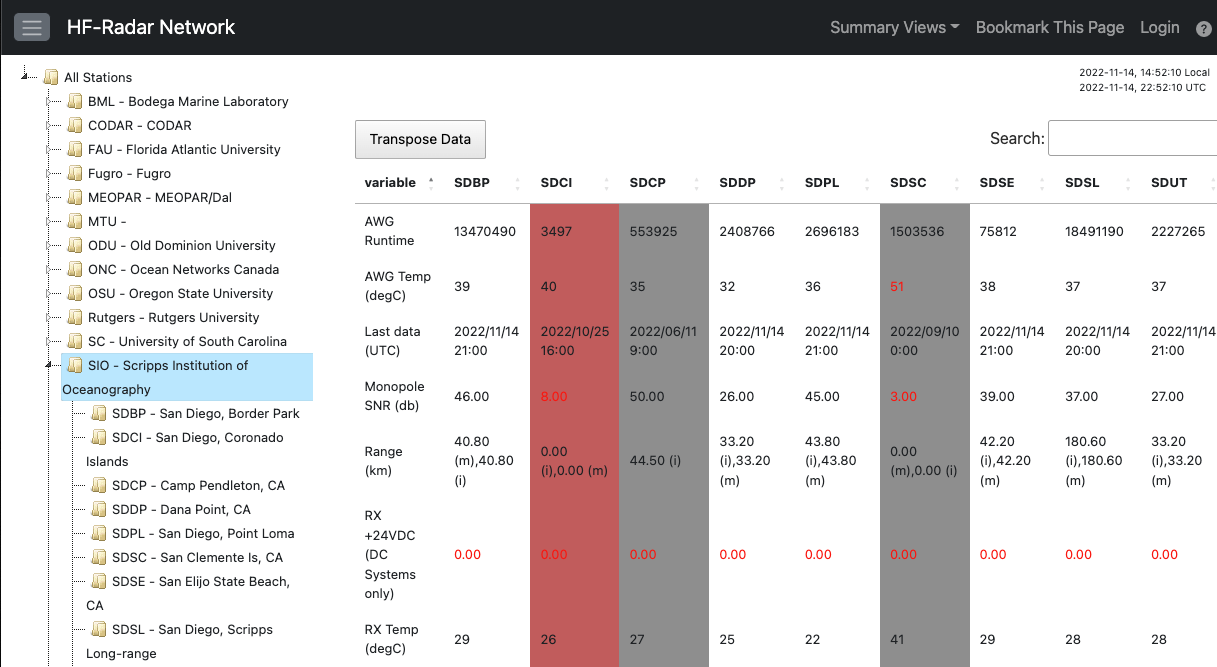
Data within these views can be sorted by clicking on the column headers.
To tranpose the data, click on 'Transpose Data'
Variables whose data fall outside of normal thresholds are colored red.
Highlighted rows/columns indicate the age of the radial files.
Row/Column Color
Age of Radial Files
White
Less than 5 hours
Yellow
Greater than 5 hours
Red
Greater than 10 hours
Grey
Greater than 30 days
Default network report showing variables outside of normal thresholds (red) and a station (SDCP) whose radial files are older than 30 daysNetwork report transposed and sorted by variable
Station View
The station view shows plots, maps, and metadata relevant to the station. It also allows the user to enter and view outages associated with the station.
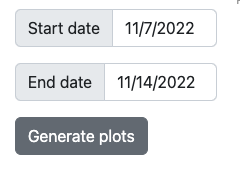
Plots within this view default to the last 7 days, although the user can also enter in their own start and end dates. When the dates are changed, any subsequent station change will default to the selected start and end date. Thus, if viewing station ABC and the user changes the dates to the last 3 days, clicking on a new station will show the last 3 days instead of the last 7.
The background color of the page indicates the age of the radial files. (see Network Views - Age of Radial Files)
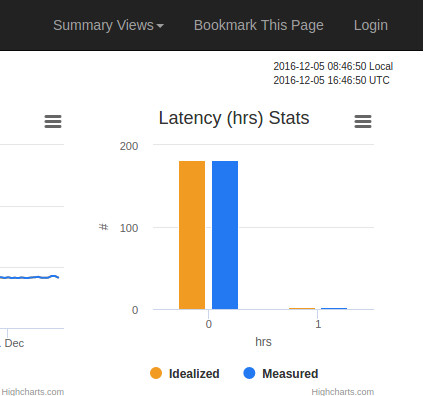
Plots
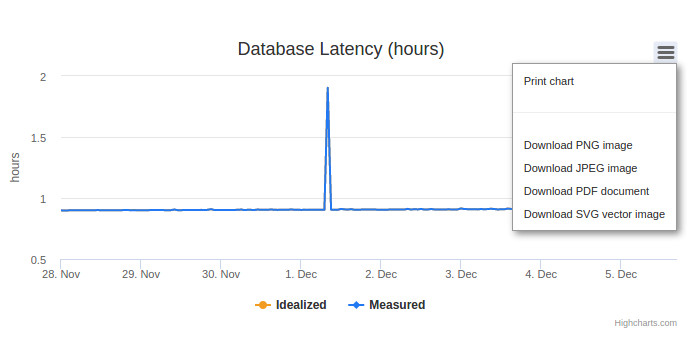
All of the plots can be downloaded by clicking on the in the top right of each plot.
Both ideal and measured are automatically loaded by default in each plot. To hide/show a particular pattern type, click on the 'Idealized' or 'Measured' text in the legend.
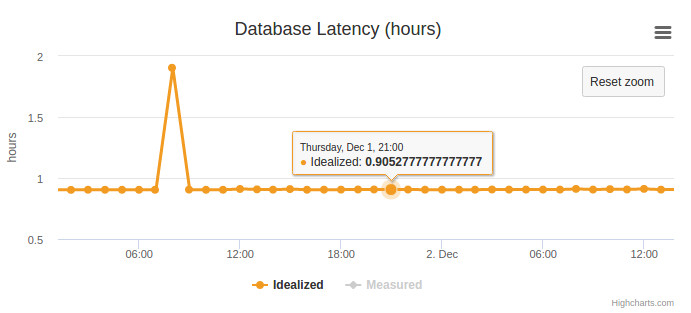
To zoom into a plot, single click and hold within the plot and drag the mouse to the end of where you wish to zoom into. To zoom out, click on 'Reset zoom'.
Options to download the plotPlot zoomed in showing only Idealized pattern typeStart date of 11/7/2022 and end date of 11/14/2022. No more 10 day limitations here.
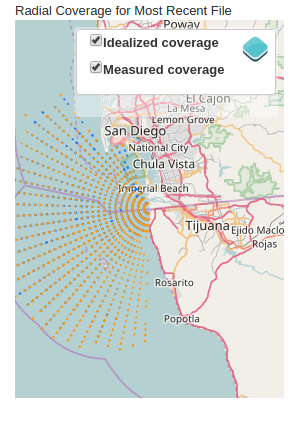
Radial Coverage
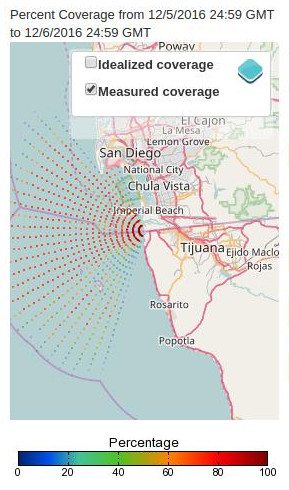
Two maps are available, one showing the radial coverage with the most recent file, and the other showing the percent coverage within the last 24 hours. By default ideal and measured are shown if available.
To hide/show a pattern type, click on the icon in the top right corner of the map and select the checkbox corresponding to the pattern type.
The most recent ideal and measured radial coveragesPercent coverage of the last 24 hours for measured radials
Bookmarking
Click on 'Bookmark This Page' to create a url that you can use to bookmark your current view.
The following is a list of items that can be bookmarked:
The tree view, whether to hide it or show it
The view (summary, network or station)
Within the summary view, the type of report
Within the network view, the network to view and the data transposed or not
Within the station view, the station to view and the start and end dates
Bookmarking your view
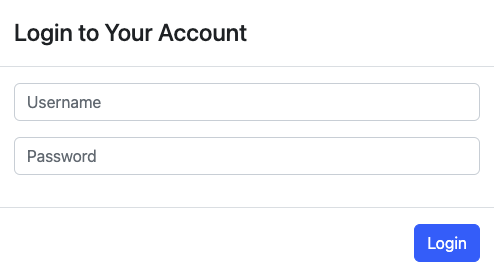
Logging in
Clicking the 'Login' text on the menu bar will open the login prompt. If you don't have a login or you need a password reset, write hfrnet.administrators for access.
Login prompt
Outages
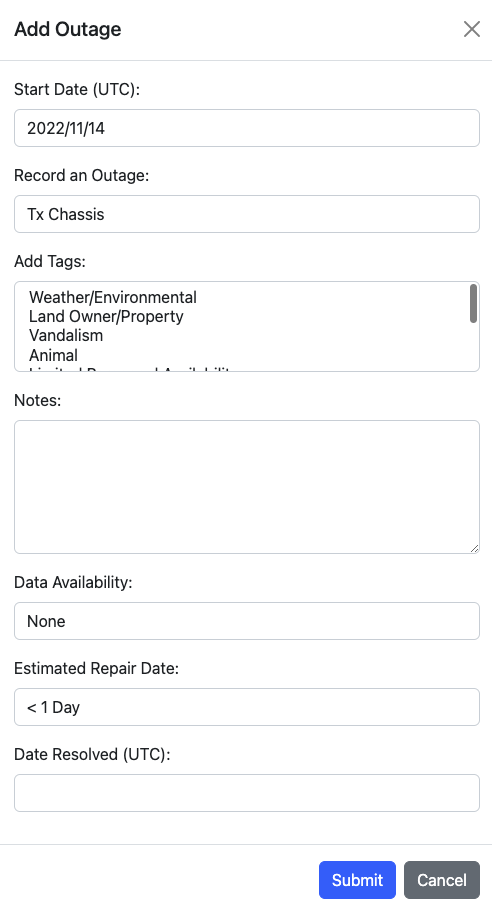
Users have specific networks that they are allowed to enter and edit outages. Once logged in, click on the 'Add Outage' button near the bottom of the 'All Outages' section, and enter the outage information in the form.
Adding an outage
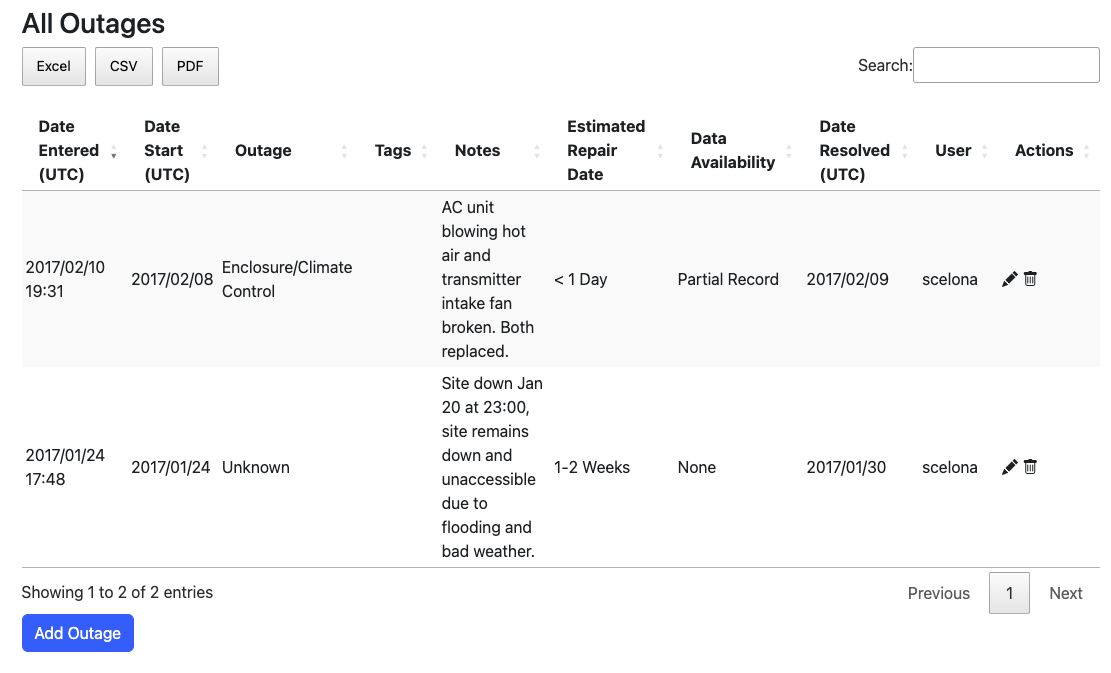
To edit an existing outage, locate the action icons next to the outage to edit. indicates edit, indicates delete.
If the user has access to a network, they will be able to add, edit and delete outages
Site Configuration
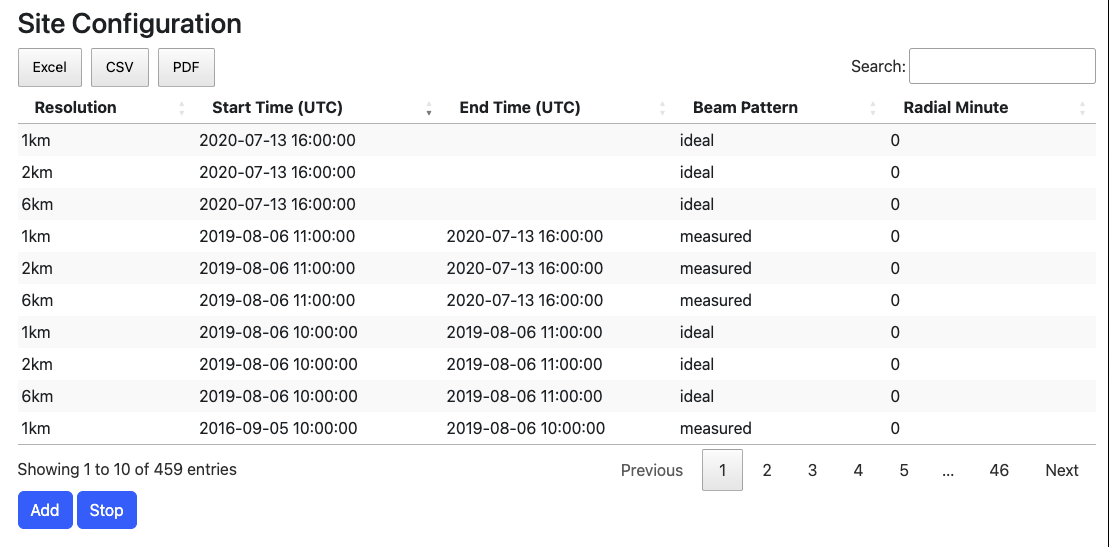
The site configuration table displays the information used in generating the total solutions.
Ideal beam pattern is used starting on 2020-07-13 16:00.
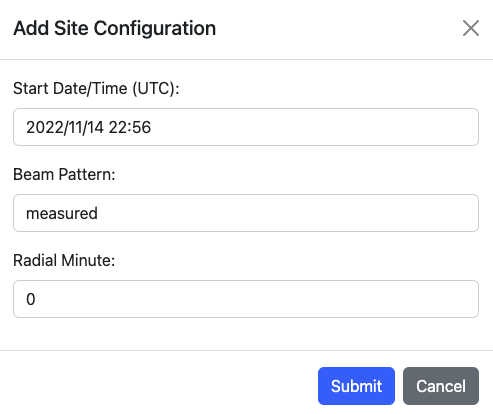
Users have specific networks that they are allowed to enter configuration data. Once logged in, the user can click the 'Add' or 'Stop' button near the bottom of the 'Site Configuration' section. In each case, the current date/time is used to add or stop the site from contributing to totals. Only the beam pattern and/or the radial minute can be updated.
Adding a new line in the configuration
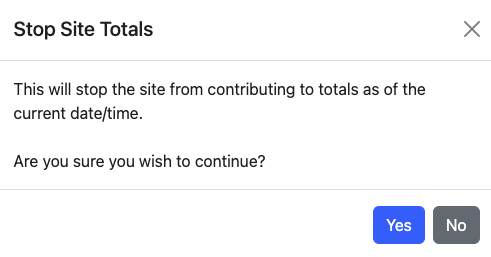
Clicking on 'Stop' will put an end date/time to the configuration table. This will prevent the site from contributing to totals solutions, but will still allow radial acquisition to continue.
Stopping the site from contributing to totals solutions.
Changes
2016-12-31 - Initial release
2017-01-30 - Added date resolved and date start and two export buttons (Excel,pdf) for outages. Increased notes size. Fixed tree not working on mobile.
2017-02-06 - Added csv export button.
2017-03-29 - Added disk usage.
2017-12-15 - Fixed outage table - Incorrect date sorts
2018-11-14 - Fixed metadata not showing latest info between ideal vs measured
2022-11-10 - Added site config information